Francis changelog
Dashboards

Dashboards
Today we're launching Dashboards, an entirely new reporting environment in Francis and our most requested feature to date.
Reporting in Francis has been rigid, with few options for customization. Your feedback was consistent: the lack of flexibility made it hard to share findings with your teams. Dashboards is our answer — the place you monitor the business is now also the place you report on it, with no deck to rebuild every month.
Charts, tables, and metrics
Dashboards are built from three components: charts, tables, and metrics. Each serves a different purpose. All are built to be flexible.
Use metrics to highlight KPIs, charts to show trends, and tables for departmental breakdowns or budget-variance analysis. Combine and arrange them to fit your story, and fine-tune the details, down to the ordering of table columns.
Headings, commentary, and images
Text commentary has been one of the most requested features on our roadmap. Numbers rarely speak for themselves. Dashboards support rich text formatting and three heading levels, so you can structure sections, explain variance, and guide readers through what they're looking at.
Dashboards also support image uploads, giving you full control of the look and feel of both live dashboards and exported reports.
Live dashboards and monthly reports
Your feedback pointed to two problems: business partnering needs live-updating dashboards, and management and board reporting needs more flexibility. We solved both in one feature.
Dashboards are live-connected to your financial model, so you and your stakeholders always see the latest picture. When it's time to present, they export to a clean PDF, the preferred format for management and investor reporting.
Business partnering
Dashboards work with Francis' limited viewer roles. Share individual dashboards with department heads or regional managers to give them access to their own numbers, without opening up the rest of your financial model. Everyone sees what's relevant to them, and nothing more.
Dashboards are available to every Francis user today. Read more in the docs.
Delta syncs

We've improved how Francis pulls transactions from connected data sources by introducing delta syncs.
Early indications show sync times reduced by 99%. This opens up new use cases and makes Francis more viable for controlling workflows.
As delta syncs are still in beta, Francis may occasionally fall back to a full sync. We're continuing to improve this in the coming months.
Multi-dimensional breakdowns

Francis now imports all available dimensions from Microsoft Business Central and Visma e-conomic. This means you can now create nested breakdowns across multiple dimensions simultaneously, building hierarchical structures that match how your business operates – like planning across Channel → Product Category → SKU.
This works seamlessly with entity breakdowns and rollups, so multi-entity groups can plan across legal structures and operational dimensions in a single hierarchal structure.
How it works
Go to the "Sheets" list in the sidebar and click the ellipsis icon (…)
From the drop-down, select Breakdown and choose your desired dimension
Repeat the for subsequent breakdowns along a different dimension
Dimensions in Google Sheets

Our Google Sheets integration now supports dimensions. When you import transaction data, you can include departments, projects, regions, or other dimensions – bringing the same dimension-level detail you get from native integrations to any data source.
This is especially useful if you're importing data from an ERP we don't yet support natively. Your manual imports can now carry the same dimensional structure as automated connections.
How it works
Go to Settings → Integrations → Google Sheets and select Connect
Choose the Detailed entries template
Add dimension values in column E of your spreadsheet
If you leave column E empty, Francis imports the data without dimensions. You can also add dimensions to existing sheets retroactively by populating column E and triggering a manual sync from the integration settings.
Limitations
Google Sheets imports support one dimension per dataset. If you need multiple dimensions (e.g., both department and project on the same transactions), upvote this on our roadmap and we'll notify you when it's available.
Nested breakdowns

Finance teams managing multi-entity group structures often need to plan each entity along a dimension – whether that's department, region, or product line. Until now, this required building separate structures for each entity and manually consolidating them to produce a group-wide view.
Nested breakdowns eliminate this overhead. Define a single structure that breaks down by entity, then by dimension, with consolidation handled automatically across your entire group.
The feature integrates fully with rollups, enabling sub-groupings at any level of the hierarchy: group entities by region, or aggregate dimension values like general and admin into a combined “General & admin” view.
One unified structure, automatic consolidation, significantly reduced model maintenance.
Rollups

Rollups let you create meaningful sub-consolidations within a breakdown. If your Francis model contains multiple entities or uses dimensions for planning, you can now group sub-sheets into rollups. In the image above, Central Europe is a rollup that contains the sub-sheets Germany and France.
Visma e-conomic draft entries (kassekladder)

Our Visma e-conomic integration now supports draft entries, also known as kassekladder or kladdeposteringer. Previously, the integration only supported finalized entries and ignored draft entries entirely.
With draft entries enabled, Francis becomes more integrated into your controlling workflows. You can analyze the effects of draft entries on financial reports before finalizing and closing the books for a specific month.
To enable draft entries for Visma e-conomic connections, navigate to Settings > Active integrations > Visma e-conomic. Select an active connection, then enable Include draft entries (kassekladder) in the configuration.
Comments

With the introduction of comments, we're making it easier to collaborate with your team on financial plans. Leverage input from stakeholders across your organization to fine-tune budgets and ensure greater accuracy. To leave a comment, simply right-click on a cell and choose Comment from the action menu.
@Mentions
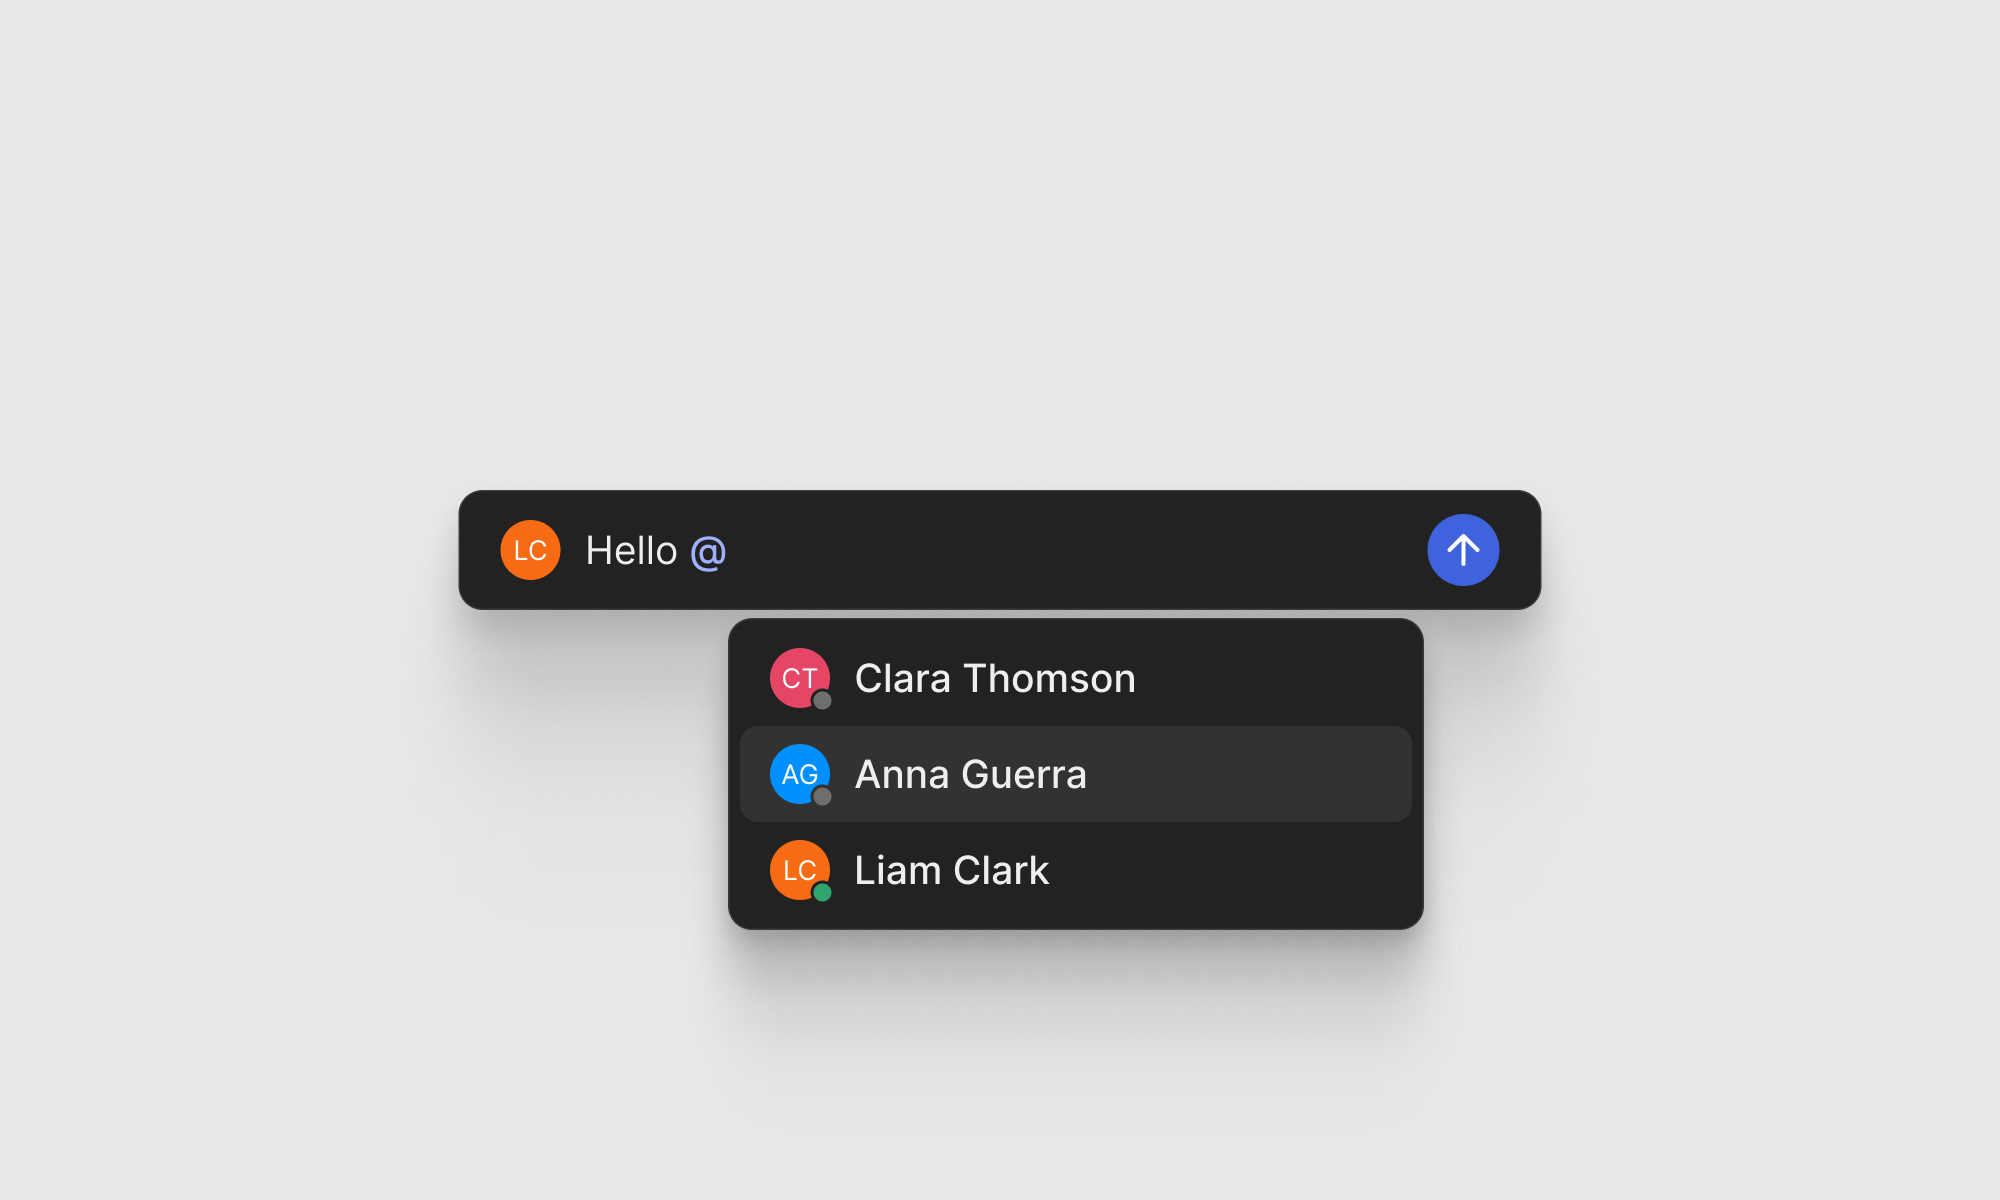
Francis comments include a built-in mention feature, enabling you to tag team members and direct their attention to specific sections of your model. When you mention someone, they’ll be notified via email about your comment, encouraging them to reply promptly.
Email notifications
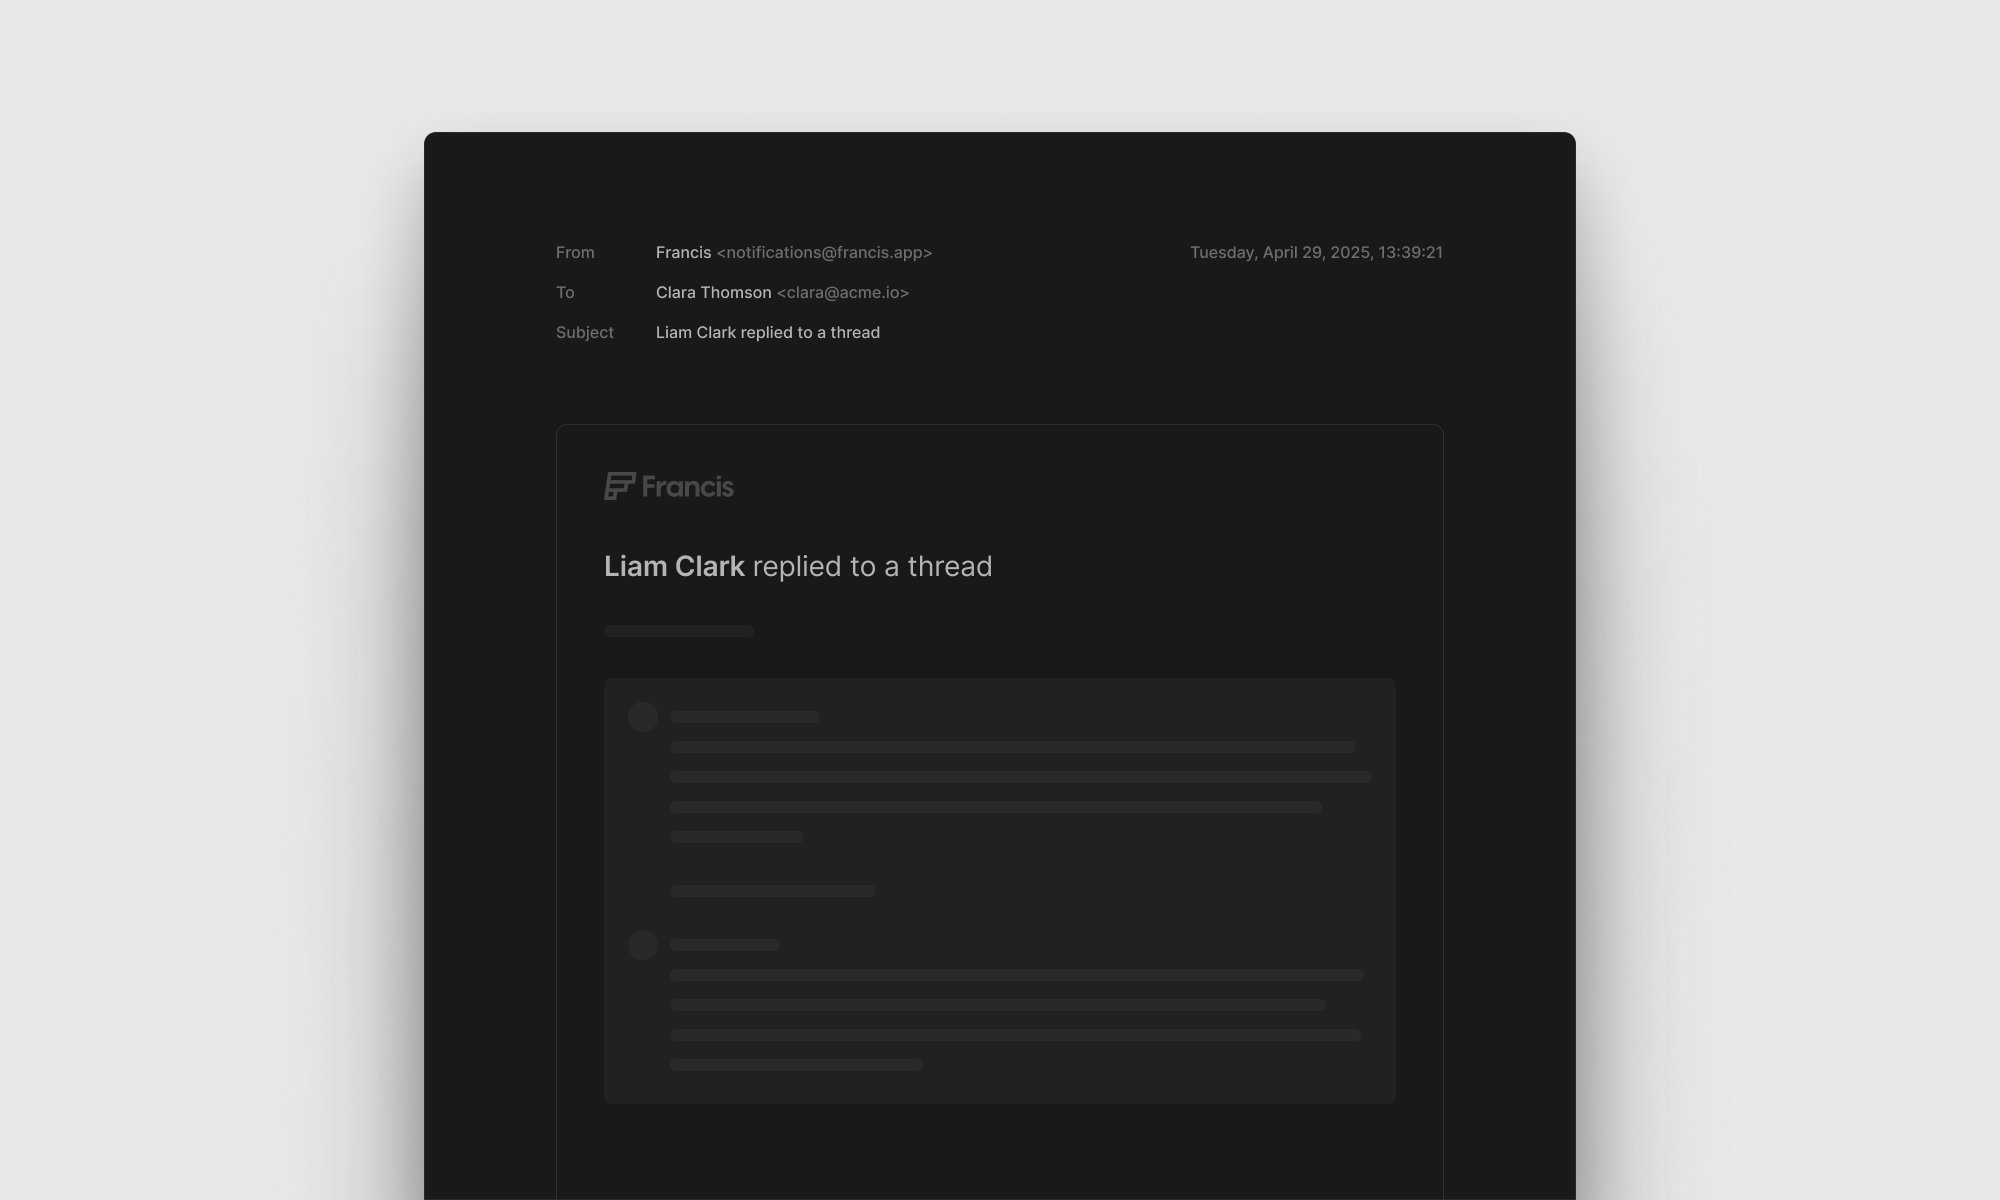
We want to keep you informed, so we've introduced email notifications as a built-in feature for comments. This means you'll receive email updates whenever someone mentions you directly or posts a reply in a thread where you're the original author or have previously contributed.
Confidentiality
Comments are fully compatible with Francis' confidentiality features. More specifically, users with limited access will be able to leave comments, making it easier to include these stakeholders in the planning process and eliminating the need for parallel emailing.